UNIVERSITY OF WISCONSIN River Falls
Education Indicators
Per Pupil Expenditure

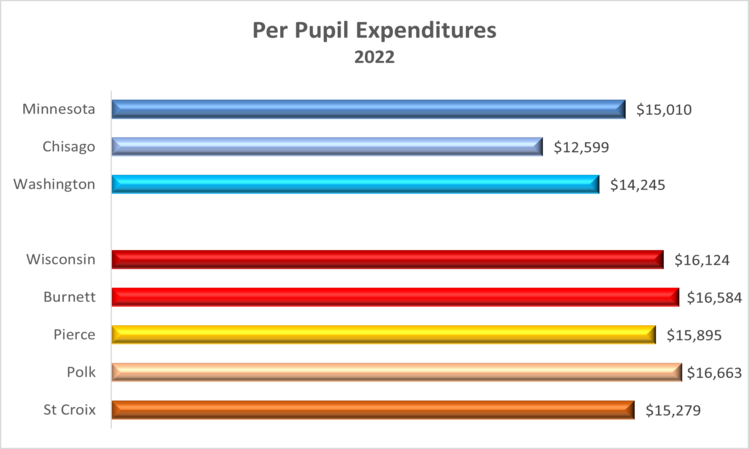
- Surprisingly, expenditures per pupil in Washington and Chisago Counties were lower than the state of Minnesota average.
- While Pierce and St. Croix counties spent less per pupil than the state average, Burnett and Polk spent slightly more per pupil than the average for Wisconsin.
- Wisconsin’s expenditures per pupil tended to be higher than those in Minnesota.

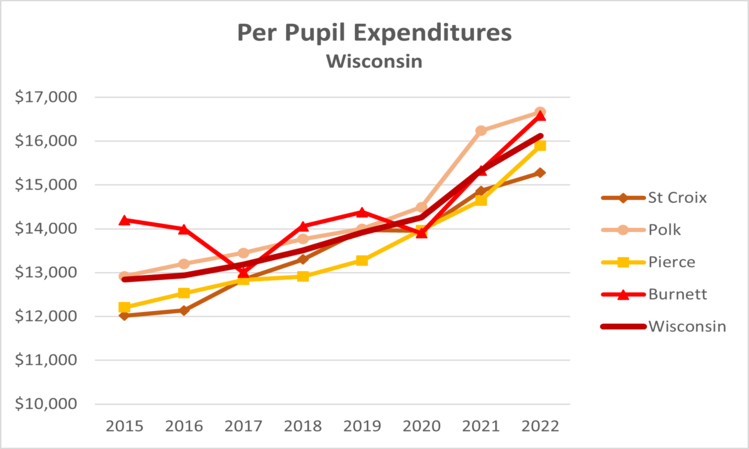
- Expenditures per pupil in Wisconsin have been increasing at a faster rate in most jurisdictions since 2020, possibly as a consequence of then impact of the COVID-19 pandemic in education in terms of providing resources for remote/online classes.
- Pierce and St. Croix counties have consistently spent less than the state average in terms of expenditures per pupil per year.
- Note, the vertical axis starts at $10,000 rather than $0.

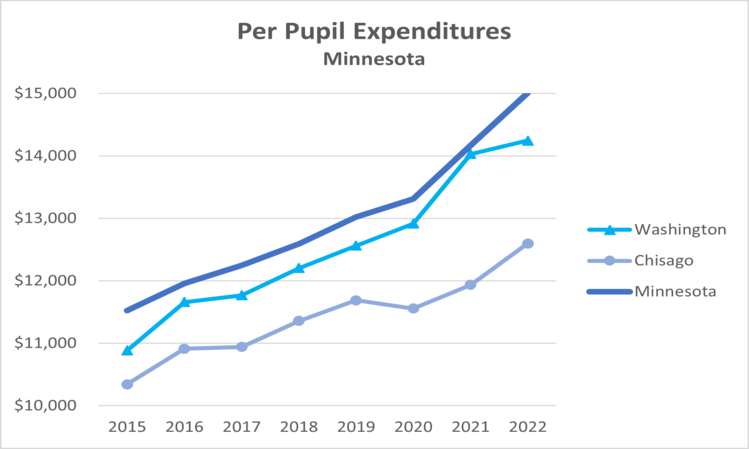
- Expenditures per pupil in Wisconsin have been increasing at a faster rate in all three jurisdictions shown in the graph since 2020, possibly as a consequence of then impact of the COVID-19 pandemic in education in terms of providing resources for remote/online classes.
- The graph shows that the lower-than-state-average expenditures per pupil noted for Washington and Chisago in 2022, were not unusual. Both counties have consistently been lower than the Minnesota average.
- Note, the vertical axis starts at $10,000 rather than $0.


