UNIVERSITY OF WISCONSIN River Falls
Economic Indicators
Unemployment

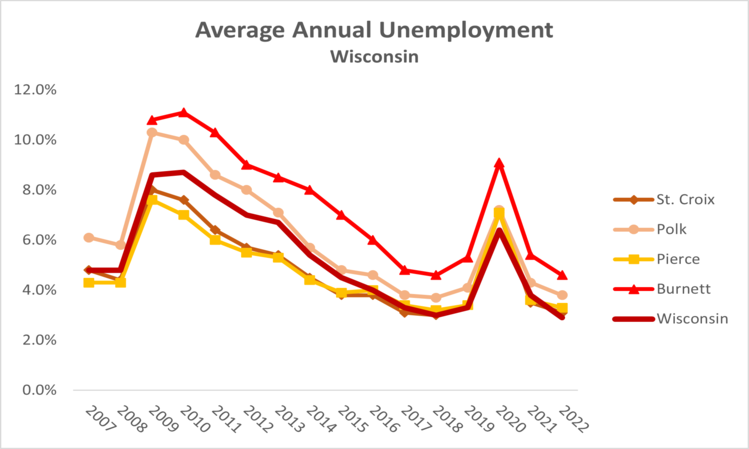
- Peak unemployment in Wisconsin in 2010 (8.7%) was similar to the national average, but it was much worse in Polk and Burnett counties and substantially better in Pierce and St. Croix counties.
- Unemployment fell for all jurisdictions between 2010 and 2018 and all experienced a slight uptick in unemployment in 2019, followed by a much stronger uptick in unemployment in 2020 due to the impact of COVID-19 in the economy. Even with the sharp increase in unemployment, rates were still lower than at the height of the Great Recession between 2009-10.
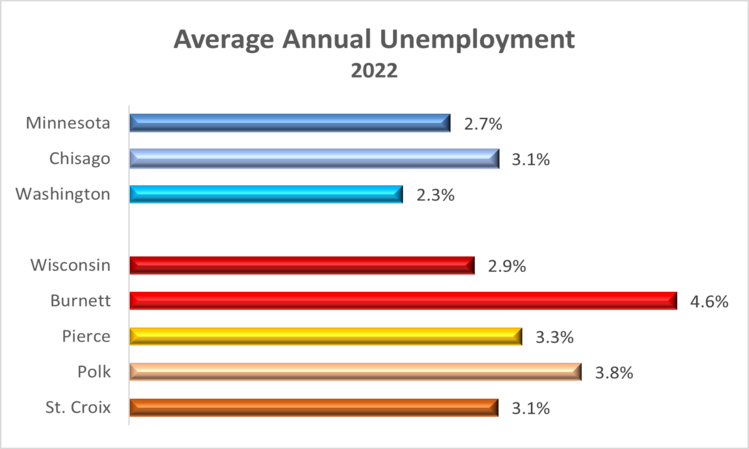
- Given a decrease in Wisconsin’s unemployment rate (which is below 3% for the first time in the period going back to 2007), all counties on the Wisconsin side of the St. Croix River Valley now observe higher unemployment rates compared to the state average.
- All Wisconsin jurisdictions that participate in this project observed lower unemployment rates compared to pre-pandemic levels.

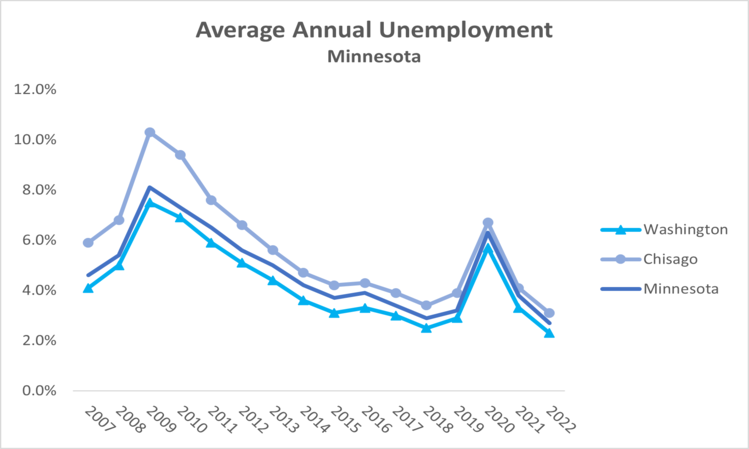
- Compared to the U.S. as a whole, Minnesota fared somewhat better during the Great Recession with unemployment topping out at 8% (vs. 9% at the national level).
- Chisago County fared worse in the Great Recession, reaching a peak of 10.3% in 2009 and, though the rate fell dramatically (to 3.4% in 2018 and 3.1% in 2022), it has remained slightly above the state rate throughout these years.
- Washington County’s experience with unemployment matches Minnesota’s experience but has been slightly lower throughout these years.
- All jurisdictions experienced a strong uptick in unemployment in 2020 due to the impact of the COVID-19 pandemic. Even with the sharp increase in unemployment (the highest in a decade), unemployment rates were still lower than at the height of the Great Recession between 2009-10.
- Minnesota, along with Chisago and Washington counties, now have a lower unemployment rate compared to pre-pandemic levels.

- For years, economists felt that 5% unemployment represented “full employment” because there are always people who are out of work as they change employers or career paths. They referred to this as “frictional unemployment.”
- Unemployment in 2022 was well below this level of frictional unemployment in all but one jurisdiction.
- Clearly, Burnett County has a more challenging employment picture than the other jurisdictions.


